PageSpeed Insights: how to read field data and lab data reports
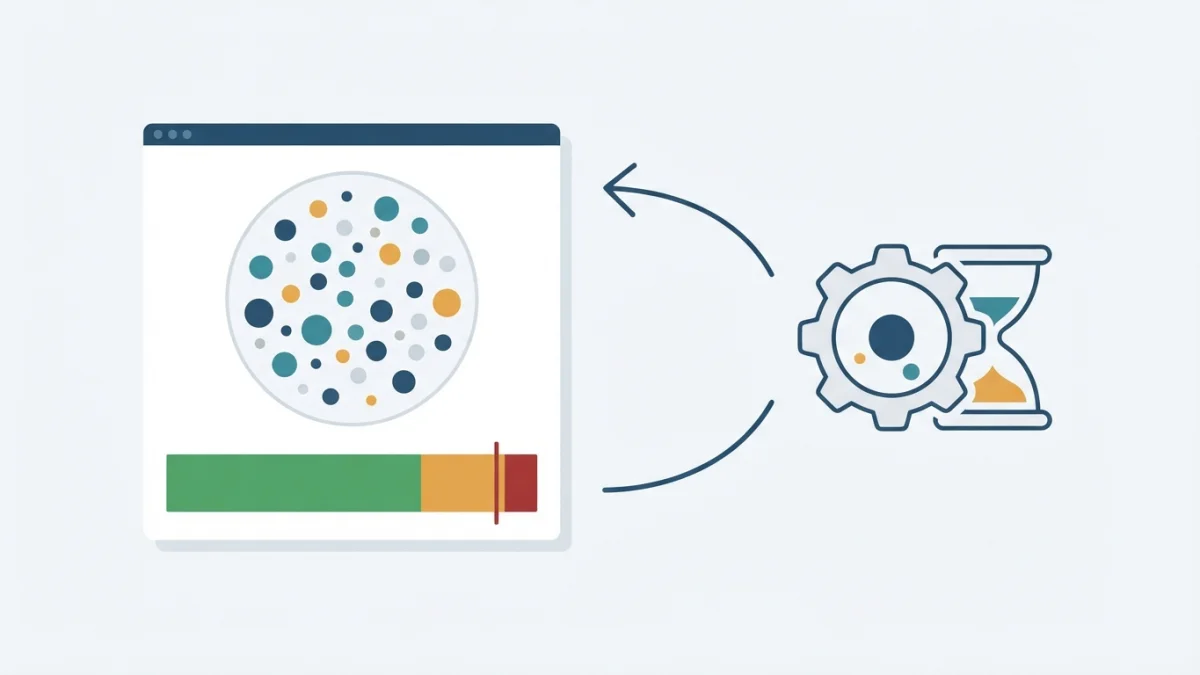
Table of contents
Open PageSpeed Insights and you get two reports of the same site that disagree: one measures your real users, the other simulates a single load. If you don't know which one counts, you'll fix the wrong thing.
The field data block sits on top; the lab data block below it. Here's where every number comes from and the order in which to fix whatever shows up in red.
What PageSpeed Insights measures and where each number comes from
According to the official documentation, lab data is useful for debugging because it is collected "in a controlled environment", though it may fail to capture real-world bottlenecks; field data captures the real experience, with "a more limited set of metrics".
The field block shows five metrics with official thresholds: FCP (1,800 / 3,000 ms), LCP (2,500 / 4,000 ms), CLS (0.1 / 0.25), INP (200 / 500 ms) and TTFB, flagged as experimental (800 / 1,800 ms). The lab block lists a different set (FCP, LCP, Speed Index, CLS, Time to Interactive and TBT), so the two never map one to one. And the whole report changes with the Mobile/Desktop switch.
One warning that saves confusion: "the API is versioned as v5, however the Lighthouse version is independent and updated regularly". The engine moved to Lighthouse 13.0 in October 2025 and now runs 13.5.0: before you panic over a score that dropped on its own, check which version signed the report.
Field data (CrUX): real users, 28 days and the 75th percentile
Field data is powered by the Chrome UX Report: "Real-user experience data in PSI is powered by the Chrome User Experience Report (CrUX) dataset". It covers the previous 28 days of FCP, INP, LCP and CLS.
The big number is the 75th percentile: "The 75th percentile is selected so that developers can understand the most frustrating user experiences on their site". It is not an average, it is the value that 25% of loads do worse than. The bars split every load and the p75 sits above them: a green p75 with a wide amber bar tells another story.
Three conditions must be met before field data exists. First, the page must be publicly discoverable: "A page must be publicly discoverable to be considered for inclusion in the CrUX dataset", with HTTP 200 and no noindex. Second, it must get enough traffic: "An exact number is not disclosed", and you cannot submit a page by hand. Third, the user must qualify, and here is the detail almost nobody knows: Chrome on iOS, Android apps using WebView and other Chromium browsers such as Edge contribute no data. If your audience is mostly on iPhone, CrUX never measures it.
For new or low-traffic pages, "PSI will fall back to origin-level granularity, which encompasses all user experiences on all pages of the website": the number blends your whole domain.
The case of SPAs and soft navigations
CrUX documents one more limitation: in a single-page app, JavaScript route changes "appear as new page views to the user, but to Chrome and the underlying platform APIs the entire experience is attributed to the initial page view".
Lab data (Lighthouse): one load, simulated
PSI "uses Lighthouse to analyze the given URL in a simulated environment", on a Google datacenter. Because it runs on a server, your own connection plays no part.
The conditions are fixed: "Lighthouse applies network throttling to emulate the ~85th percentile mobile connection speed", using the Slow 4G preset (150 ms latency and 1.6 Mbps down / 750 Kbps up) plus "a constant 4x CPU multiplier" to emulate a mid-tier phone. With simulated throttling, Lighthouse "uses a simulation of a page load, based on the data observed in the initial unthrottled load": it loads fast first and then estimates how long Slow 4G would have taken.
The score reads exactly as stated: "A score of 90 or above is considered good. 50 to 89 is a score that needs improvement, and below 50 is considered poor". It is a weighted average (LCP 25%, TBT 30%, CLS 25%, FCP 10% and Speed Index 10%) per the scoring docs. TBT is the lab proxy for INP, which cannot be measured without a user.
Why field and lab data disagree (and which one counts)
The short rule: field data decides whether there is a real problem; lab data explains the cause. If you cannot get both green, prioritise field data. "The field data is a historical report about how a particular URL has performed. The lab data is based on a simulated load of a page on a single device and fixed set of network conditions."
Hence the key line: "having good lab data does not necessarily mean real-user experiences will also be good". A lab score of 98 with a red field block comes from third parties (analytics, consent, video, advertising) that do not weigh the same in a simulation, from real devices that Slow 4G only approximates, and from the origin-level fallback. The reverse also happens: green field data with a red lab score.
How to read a PageSpeed Insights report in 5 steps
- Check whether field data exists. If PSI warns that data is missing and shows origin level, the number blends every page.
- Read the Core Web Vitals assessment, not the score. "The aggregation passes the Core Web Vitals assessment if the 75th percentiles of all three metrics are Good"; if LCP or CLS is missing there is no assessment.
- Read the bars before the percentile: a green p75 with a wide amber bar means a meaningful share of users struggles.
- Drop into the lab for the why (TBT, simulated LCP and audits). Order of attack: interactivity, then LCP and then CLS.
- Measure the field block again 28 days later: it is a rolling average and will not move overnight.
The Lighthouse score is not a ranking factor
Google Search states: "Core Web Vitals are used by our ranking systems". Then it adds the nuance almost nobody quotes: "getting good results in reports like Search Console's Core Web Vitals report or third-party tools doesn't guarantee that your pages will rank at the top... trying to get a perfect score just for SEO reasons may not be the best use of your time".
It also says the evaluation is page-specific and that "there is no single signal", per the page experience guide. In practice, the lab score does not enter the ranking; the Core Web Vitals measured with field data do. Optimising it helps because it usually drags the field data with it, not because it is the goal.
How to monitor without going crazy
The Core Web Vitals report in Search Console is free and CrUX-powered. You read it by URL groups, with mobile and desktop separated, the group status is that of its worst metric, and "if a URL group does not have a minimum amount of reporting data for LCP and CLS, the URL is omitted from the report".
The PageSpeed Insights API v5 returns field and lab data in one call ("a key is recommended for frequent, automated queries"): the response carries loadingExperience, originLoadingExperience and lighthouseResult.
curl -s "https://www.googleapis.com/pagespeedonline/v5/runPagespeed?url=https://example.com/&strategy=mobile" \
  | python3 -c "import json,sys; d=json.load(sys.stdin); print(d['lighthouseResult']['categories']['performance']['score'])"
If you only need field data, the CrUX API "will always show 28-days", capped at 150 queries per minute per project. And do not track the lab score daily: it is a single simulated load and varies between runs ("Why does the performance score change from run to run?").
Common mistakes when reading these reports
- Chasing a lab score of 100 as an SEO goal.
- Reading the 75th percentile as an average.
- Judging one URL with origin-level data.
- Treating TTFB as a Core Web Vital.
- Auditing mobile and desktop as one.
- Deciding from a single run, when it helps to think of "a distribution of scores, rather than a single number".
- Fixing things and never re-measuring the field after 28 days.
- Forgetting that CrUX does not see iPhone.
Checklist: reading and interpreting PageSpeed Insights in 7 steps
- Open the specific URL, not the homepage, and pick mobile.
- Confirm whether the field block is page-level or origin-level.
- Read the Core Web Vitals assessment before the score.
- Drop to the lab and note TBT and simulated LCP.
- Prioritise by metric: interactivity, LCP, CLS.
- Note the Lighthouse version and the test date.
- Return to the field block 28 days later to confirm the gain.
If there is no field data at all, check noindex, HTTP status and traffic before blaming the tool. The technical steps to fix what you find are in the guides on hosting and servers, CDNs and resource hints.
PageSpeed Insights is not an exam you have to pass with 100: it is a diagnostic panel with two thermometers. The one for your users decides whether there is a fever; the simulated one tells you where to press. What actually gets measured, and what Google uses, is the first.